Topic: Dashboard - Smart looking Report with graphs
Hi,
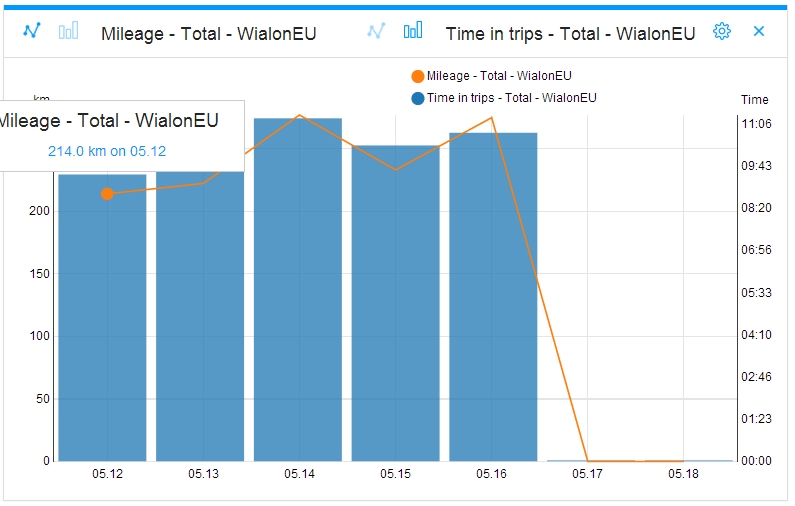
The current charting facilities in Wialon are not pretty at all. infact there sre really no options.
I need to be able to offer graphical reports dashboard to my clients. eg to be able to graph key indicators such as;
- Number of units currently on line Vrs units off line in a pie chart.
- Total miles travelled each day by all vehicles - in a trend or bar chart.
- Total engine on hours each day for a whole month - trend chart / bar chart
Has anyone already created a dashboard similarly that directly feeds from to the gurtam database?
It will be helpful if I did not have to re-invent the wheel?
I guess I am not alone requiring such functionality? Please help.


