1

Dashboard - Smart looking Report with graphs

Тема: Dashboard - Smart looking Report with graphs

Hi,
The current charting facilities in Wialon are not pretty at all. infact there sre really no options.

I need to be able to offer graphical reports dashboard to my clients. eg to be able to graph key indicators such as;
-  Number of units currently on line Vrs units off line in a pie chart.
- Total miles travelled each day by all vehicles - in a trend or bar chart.
- Total engine on hours each day for a whole month - trend chart / bar chart

Has anyone already created a dashboard similarly that directly feeds from to the gurtam database?
It will be helpful if I did not have to re-invent the wheel?

I guess I am not alone requiring such functionality? Please help.

Begin with the end in mind!
2

Dashboard - Smart looking Report with graphs

Re: Dashboard - Smart looking Report with graphs

rokojo2, hope someone will help you here.
In fact, we are thinking about creation of such dashboard for months already, but still not sure what "key indicators" should go there and in which type of charts/tables should they be...

So if we will have an agreement here - we would develop that kind of SDK app.

3

Dashboard - Smart looking Report with graphs

Re: Dashboard - Smart looking Report with graphs

hI Aliaksandr,

Thanks for your positive response.

A standard list of key performance indicators (KPI's) for my clients will include the following:

1. Live status of units under monitoring:  could include the following
1.1 A pie chart showing the number of units that are online vrs the number of units offline for less than 1 day vrs the number of units offline more than 1 day.
1.2 A bar chart showing number of units that are engine on and stationary ie idling for 0-5 mins, 6-10 minutes, 11-15 minutes and over 20 minutes

2. Mileage KPIs could include:
2.1 A bar chart showing total number of journey miles travelled by all vehicles for each day in a given calender period (could be last 7 days or last 10 days. Miles on y axis and days on x axis.
2.2 A bar chart showing the total fuel usage for all vehicles over the same range above. Total fuel usaged on y axis and days on x axis.
2.3 In a more advanced graph, you could combine 2.1 and 2.2.

3. Driver behaviour KPIs coiuld include
3.1 Top 10 drivers or vehicles with the worst total idling time in the last 7 days.
3.2 The average and maximum speeds reached by all vehicles each day in the last 7 days
3.3 The list of vehicles violating maximum speed limit in the last 24 hours

More KPIs possible but this is a good place to start.
Please let me know how we can make this happen quickly as we are facing competition from new systems coming to market.

Begin with the end in mind!
4

Dashboard - Smart looking Report with graphs

(27/11/2013 19:17:59 отредактировано Baltika)

Re: Dashboard - Smart looking Report with graphs

Good idea !!
esp for stationary units !!


regards
Baltika


Aliaksandr Kuushynau пишет:

rokojo2, hope someone will help you here.
In fact, we are thinking about creation of such dashboard for months already, but still not sure what "key indicators" should go there and in which type of charts/tables should they be...

So if we will have an agreement here - we would develop that kind of SDK app.

5

Dashboard - Smart looking Report with graphs

Re: Dashboard - Smart looking Report with graphs

Hi, rokojo2!

Thank you for the details, we DO can create that kind of an application with some pre-defined number of differently visualised charts of but some more clarifications on the listed KPIs are needed, like what would be Max speed limit from the bullet point 3.3 and whaere should it be set?
And, Baltika,  you are welcome to add new KPIs for sure, we'll start working on that.

6

Dashboard - Smart looking Report with graphs

Re: Dashboard - Smart looking Report with graphs

Hi Aliaksandr,

Exciting!

Great to hear that work will start on this type of dashboard. Cab you give any idea what the time scales will be? ie How soon before we see a first sample dashboard page?


Richard

Aliaksandr Kuushynau пишет:

Hi, rokojo2!

Thank you for the details, we DO can create that kind of an application with some pre-defined number of differently visualised charts of but some more clarifications on the listed KPIs are needed, like what would be Max speed limit from the bullet point 3.3 and whaere should it be set?
And, Baltika,  you are welcome to add new KPIs for sure, we'll start working on that.

Begin with the end in mind!
7

Dashboard - Smart looking Report with graphs

Re: Dashboard - Smart looking Report with graphs

We also believe that the dashboards - great idea. But if we are talking about the KPI, can we take part too?

If it will be possible display KPI by group of objects, i would be interested display the following indicators:

1. Duration of offline/online time per unit, in selected period - in bar chart
2. Most frequently visited places on the map, and time spent there by colors for 5+/10+/30+/60+/120+ minutes - doughnut chart on the map

To avoid the appearance of aggression in the topic temporarily stop and wait for feedback.. smile

Великий и ужасный Гиоргий Каладзе
8

Dashboard - Smart looking Report with graphs

Re: Dashboard - Smart looking Report with graphs

unitedsecurity, sure, sure we need as more KPIs as possible, to understand the wya we would build that app.
( would there be a list of pre-defined KPIs , or we will provide users to select parameters and build charts themselves)

9

Dashboard - Smart looking Report with graphs

(04/12/2013 02:17:33 отредактировано Сергей Левченко)

Re: Dashboard - Smart looking Report with graphs

I support rokojo2's and unitedsecurity's ideas. I think high quality dashboards and charts greatly improve the ease of understanding the information and make the system more user-fiendly.

Here are some ideas on presenting the ideas voiced above as well as some other ones:

Total engine hours; Distance traveled by vehicle; Idling by vehicle; Speedings - all with the ability to set thresholds - exceeding the threshold would change the color coding of the chart:
http://www.fleetmatics.com/ckeditor_upl … opy(1).jpg

Trending using charts - change over a particular time period (days, weeks, months) by vehicle / vehicle group / full fleet:
(1) fuel usage
(2) driver behavior scores
(3) speeding violations
(4) excessive idling

Industry benchmarking
Give fleet managers the ability to see how their fleet is performing compared to similar fleets - is their fleet wasting more fuel, Is it driving as safely, etc.:
http://www.fleetmatics.com/ckeditor_upl … ending.png
Here Gurtam can really leverage the vast amount of data it is collecting from all units connected to the WDC and build dynamic aggregated benchmarks to be used by fleet managers. This should probably be an extension package on the price list.

10

Dashboard - Smart looking Report with graphs

Re: Dashboard - Smart looking Report with graphs

Aliaksandr,

can you give us any update how fast this development is being considered?

The idea of benchmarking posted by SergeiLeuchanka is an absolute winner!
Just imagine the real value of such information to the Wialon Client.

.... but now lets have some idea about how long before this is all going to happen!

Begin with the end in mind!
11

Dashboard - Smart looking Report with graphs

Re: Dashboard - Smart looking Report with graphs

rokojo2, i believe that the first prototype of our Dashboard will be availabe for testing in late January.

12

Dashboard - Smart looking Report with graphs

Re: Dashboard - Smart looking Report with graphs

Hello,

This is a long-awaited feature by many of us! Great!

It would be great if this app could make tranding charts not only from the vehicles/vehicle groups, but also from the drivers/driver groups and trailers/trailer groups (trip time, mileage,fuel data /used and avarege/,violations, etc). And as well POIs/Geofenses should be interesting (time in, visits, mileage in, fuel used in, etc).

Also there are plenty of way to register cost's (service, fuel, etc.) it would be great if we could make graphs from cost, too.

Regards,
Viktor

Eflotta Vehicle Tracking Ltd, Hungary
www.eflotta.com
13

Dashboard - Smart looking Report with graphs

Re: Dashboard - Smart looking Report with graphs

Eflotta, sure.
Thank you for the comment.
Please specify how you register costs in Wialon Hosting so i will be able to plan cost-related charts in the app.

14

Dashboard - Smart looking Report with graphs

Re: Dashboard - Smart looking Report with graphs

Hello,
As well as we know there is only one way: Regester events (it can be maintenance work cost or filling cost).
Maintenance can be separeted as a "Kind of work" what is a simple text field, as "oil change","tire change","repair" etc.

Regards,
Viktor

Eflotta Vehicle Tracking Ltd, Hungary
www.eflotta.com
15

Dashboard - Smart looking Report with graphs

Re: Dashboard - Smart looking Report with graphs

I believe that this is a strong feature that the competition here in the US Fleetmatics has with the Graphics that they display in the dashboard and would be a very strong tool for Wialon to enhance all the information is there

FlexGPS
United States
16

Dashboard - Smart looking Report with graphs

Re: Dashboard - Smart looking Report with graphs

Aliaksandr Kuushynau пишет:

rokojo2, i believe that the first prototype of our Dashboard will be availabe for testing in late January.

Hi Aliaksandr, I trust you are well.
Please can you update us on the status of the dashboard prototype.


Best regards

R

Begin with the end in mind!
17

Dashboard - Smart looking Report with graphs

Re: Dashboard - Smart looking Report with graphs

Hi!
Those, reading that topic can be first ones to check the dashboard.
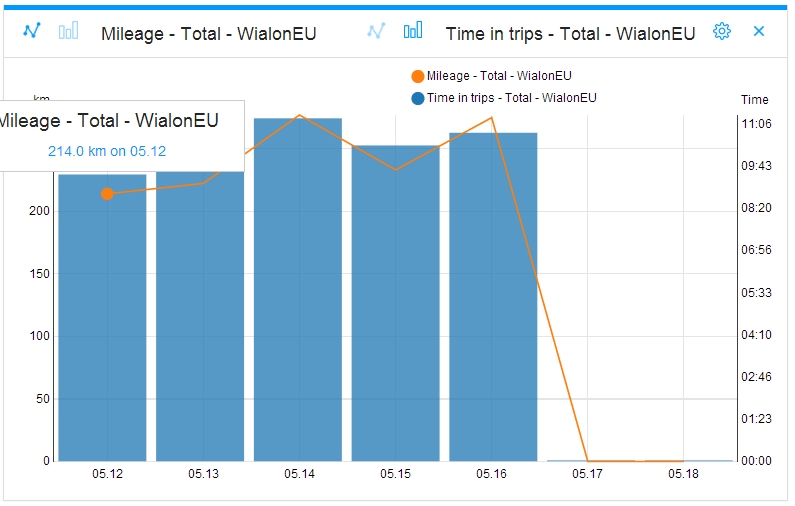
(while it's still not released it will not be visible at apps.wialon.com and to run it you should start any app and than in the address field change appname to dashboard and keep all the rest of url intact )
Dashboard - Smart looking Report with graphs
so change trackplayer to dashboard and voilà!

18

Dashboard - Smart looking Report with graphs

(20/02/2014 14:49:20 отредактировано wwbusch aka Buwo)

Re: Dashboard - Smart looking Report with graphs

Works great...

some comments:
- i miss a "check all" or "unckeck all" button in the graphs, i saw that i can enable / disable each unit
but if i have 10 units and want to see only one i need to uncheck 9

--> my error, just double click to one unit and they are all unchecked.


- it would be great to have "the day" under the date, for example

11.02   12.02    13.02
(Mon)     (Tue)  (Wed)

- one configurable chart based on reports...
it would allow to generate own charts which can be configured via a report.

Wolf

Politeness dictates it to write his name on a post
19

Dashboard - Smart looking Report with graphs

Re: Dashboard - Smart looking Report with graphs

Hi Aliaksandr,

Given that I started this whole thread it will be helpful if I can also have access to see the dashboard in development. I have tried several times but I guess I do not have enough rights to see this. Can you help??

rokojo2

Begin with the end in mind!
20

Dashboard - Smart looking Report with graphs

Re: Dashboard - Smart looking Report with graphs

rokojo2,
Please, send your request to support@gurtam.com

Dmitry Posadski
Head of Wialon Implementation Team
21

Dashboard - Smart looking Report with graphs

Re: Dashboard - Smart looking Report with graphs

This topic is intended to capture information regarding the new Dashboard application on its usage and any bugs or chnages that may be needed. The fact that it is available for both the PC and mobile devices makes it a formidable report visualization tool. I hope we see more of the same with other applications.

Phoenix Solusi
Mobile Visible Secure
Specialists in data acquisition and analysis for mobile and fixed assets. Integration in to content management systems is a specialty we have.
22

Dashboard - Smart looking Report with graphs

Re: Dashboard - Smart looking Report with graphs

Hello all

Awesome that idea, where i can see it in English, please

Regards

Jose

23

Dashboard - Smart looking Report with graphs

Re: Dashboard - Smart looking Report with graphs

jose.rumbaut, it's already available. you can test at http://apps.wialon.com/index.php?lang=en
or read more at http://weblog.gurtam.com/2014/03/new-pr … -hannover/

24

Dashboard - Smart looking Report with graphs

Re: Dashboard - Smart looking Report with graphs

This is where I hope we can get to with Dashboard and sensolator

http://transpara.com/products/

Having a solid telematics platform like Wialon and being able to do device based analytics on mobile devices allows taping into some interesting verticals.

Phoenix Solusi
Mobile Visible Secure
Specialists in data acquisition and analysis for mobile and fixed assets. Integration in to content management systems is a specialty we have.
25

Dashboard - Smart looking Report with graphs

Re: Dashboard - Smart looking Report with graphs

We've also released an Android application with same functionality
https://play.google.com/store/apps/deta … .dashboard

And there's a multichart option available now.
Dashboard - Smart looking Report with graphs